
Landscape genomics of oaks in the face of climate change
Investigators: Victoria Sork, Paul Gugger, Jessica Wright, Matteo Pellegrini, Stephanie Steele
Climate change over the last hundred years has jeopardized species and ecosystems throughout the world by altering local climate conditions and shifting current climate zones to new locations. This rapid climate change is of particular concern for tree species that define the ecosystem they occupy and shape local biodiversity. The ability of local populations to respond to climate change will depend largely on their underlying genetic structure. In our laboratory, we are investigating geographic patterns of genetic variation in a California valley oak,Quercus lobata Née, by deploying cutting-edge genomic tools to assess how the underlying genetic structure of populations might influence this species’ ability to survive climate change. Modern genomics has made it possible to study nonmodel species and identify the genetic basis of traits associated with response to climate, such as bud burst, cold and heat tolerance, and osmotic stress. Key questions for landscape genomics are whether the geographic distribution of variation in their DNA sequences is associated with climate gradients and to what extent do they predict phenotypic variation among sites in response to climate change.
Our laboratory has identified candidate genes associated with functional traits for response to climate change and conducted preliminary tests of their association with geographical and environmental gradients. Eventually, we want to expand the number of SNPs and sample locations so that we can map geographic patterns and we also intend to initiate provenance studies to map SNPs associated within these genes onto phenotypic traits and to measure gene expression in selected traits.
Our preliminary studies of 13 sites and 45 individuals indicate several genes show an association with climate variables (Sork et al. in prep).
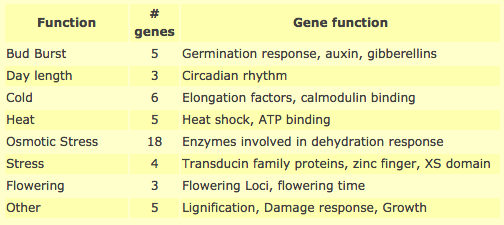
| Table 1. Candidate genes currently under study for valley oak. |
|---|
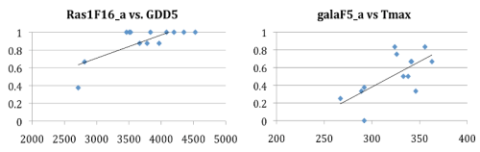
| Figure 1. Examples of gradients in SNPs associated with bud burst genes in Q. lobata. |
|---|
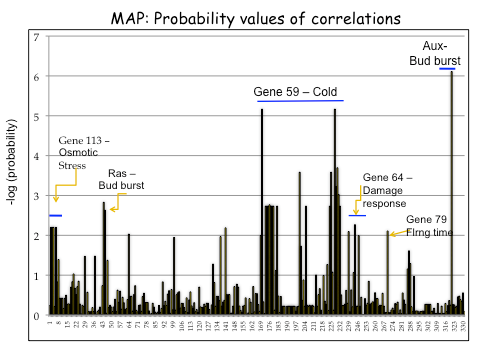
| Figure 2. Outlier analysis for correlations between 442 snps and mean annual precipitation (MAP) in Q. Lobata. Genes with outlier snps are indicated. Horizontal line indicates the range of snps for a given gene. |
|---|
 |